Graph Viewer
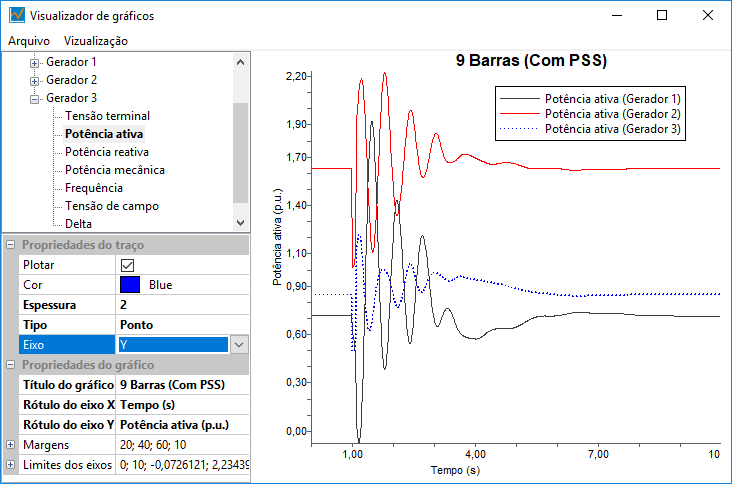
To display the results from stability calculations and frequency sweep, a graph viewer was developed, as shown below:

Curve creation, manipulation, and navigation
This viewer uses the wxMathPlot library and allows the user to plot all time-domain curves from stability and frequency sweep results.
They are organized hierarchically in a tree structure, identified by the power element type and name, as well as the curve type.
Curves can be plotted by double-clicking on them or by checking the "Plot" box in the trace properties.
The printed graphs can be customized by editing their trace properties: color, thickness, and line style (six types available).
By default, the vertical axis is time (in stability) or frequency (frequency sweep), but the user can switch to any available curve.
Several general graph properties can be edited: title, x and y-axis labels, margins, and axis limits.
The View menu allows enabling legends, grid lines, and mouse pointer coordinates (used to highlight points on the curve), as well as toggling between light and dark themes for better visualization or export.
In the File menu, the graph can be saved as an image (.png, .jpg, or .bmp) or copied directly to the clipboard.
The same menu also allows exporting in CSV (Comma-separated Values) format, which can be used in other graph viewers, like Excel or gnuplot.
The plotting area allows navigation using zoom tools, selection areas, mouse commands, and curve dragging.
Right-clicking on the plotting area shows manipulation options through a context menu.
The following mouse commands are used to navigate curves:
| Command | Action |
|---|---|
| Left button pressed + Select area | Selects zoom area |
| Right button pressed + Move mouse | Drags the curve |
| Mouse wheel | Vertical scroll |
| Mouse wheel + Shift | Horizontal scroll |
| Mouse wheel + Ctrl | Zoom in/out |