Voltage Map
The Voltage Map tool uses the concept of a heat map to display the voltage values of all buses in the system using colors.
This tool is useful for identifying buses with under- and overvoltages in the power system, as well as the effect of inserting/removing system elements.
The legend correlating the voltage magnitude values with colors is displayed on the left side of the workspace.
Enabling the Voltage Map tool
The tool can be enabled or disabled in the Tools Ribbon submenu by clicking the Voltage Map button or using the "Ctrl + Shift + H" keyboard shortcut.
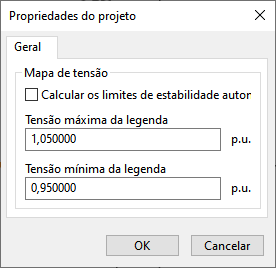
The tool settings can also be accessed in the Tools Ribbon submenu by clicking the Project settings button.

In the current program version, only the voltage map options are displayed in the project settings.
The upper and lower limits, in , are edited in this form.
Alternatively, the program can automatically calculate the limits.
In this case, the upper limit will be the highest voltage in the circuit and the lower limit will be the lowest voltage in the circuit.
Automatic limit calculation may hinder the identification of buses with under- and overvoltages in the system.